- Ben Haresign
- 21 Jun, 2026
- Access
- 27 min read
Why can’t I get a GP appointment? Follow the money
General practice · Access · Funding
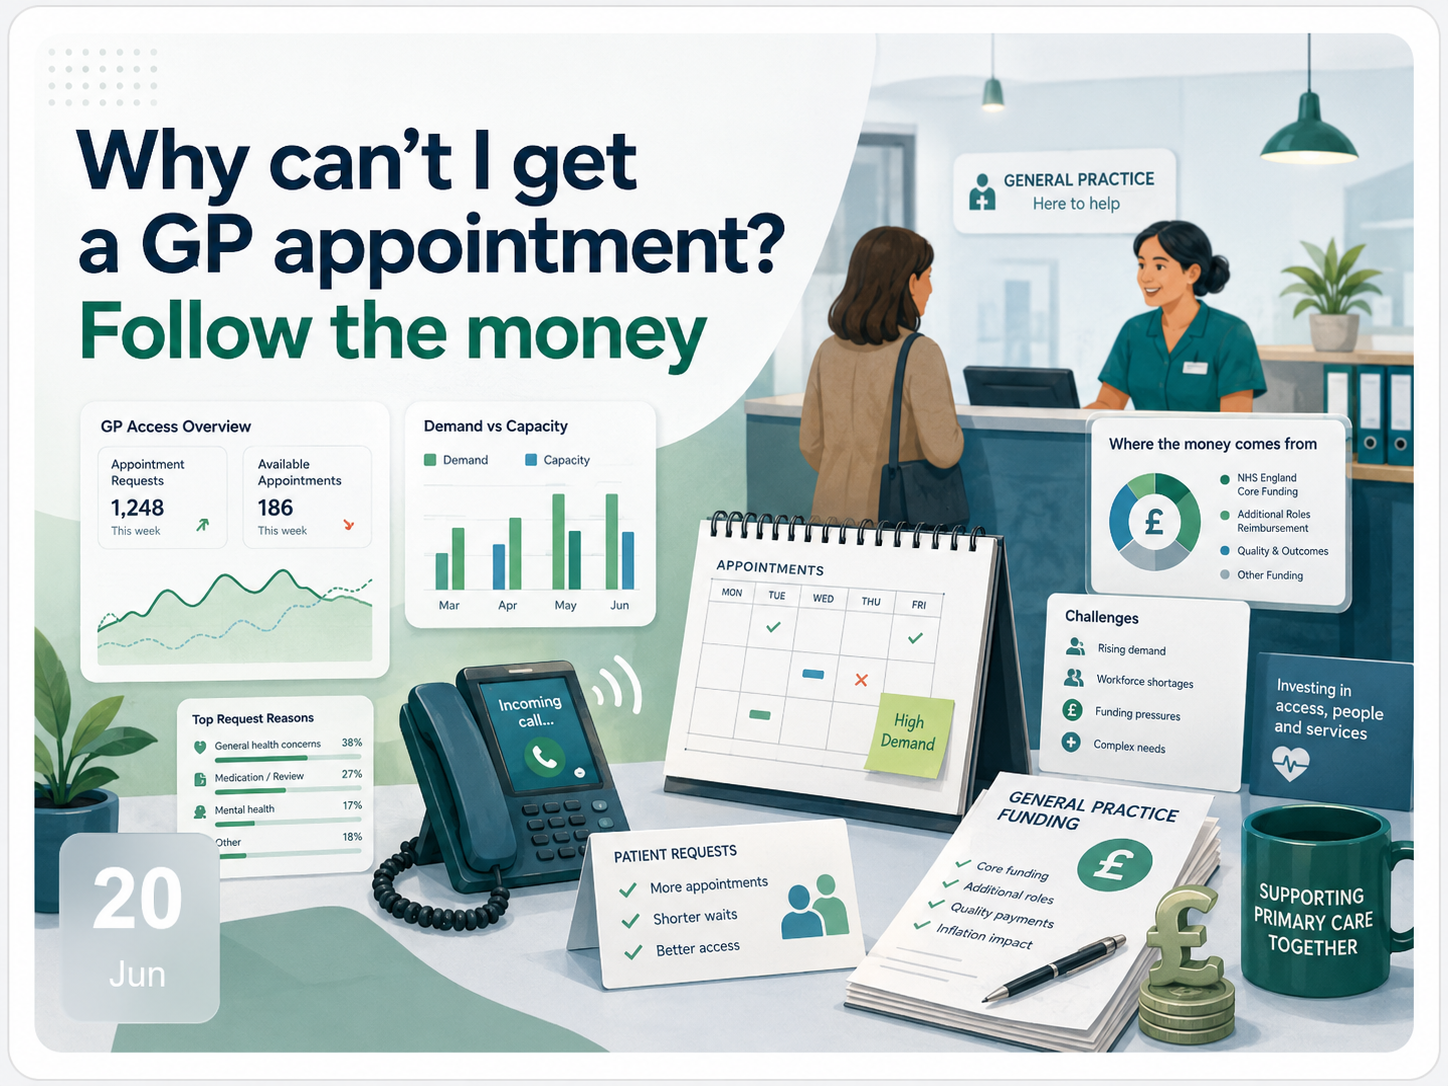
General practice is delivering millions of appointments, answering tens of millions of calls and managing rapidly growing online demand. Yet many patients still find it difficult to access care. The problem is not that practices have stopped working. It is that demand has expanded faster than the capacity funded to receive, assess and treat it.
The blunt answer
England has built a system in which general practice is expected to operate as the NHS switchboard, triage hub, prevention engine and community front door — without consistently funding the front door as though it were the front door.
General practice is not doing less
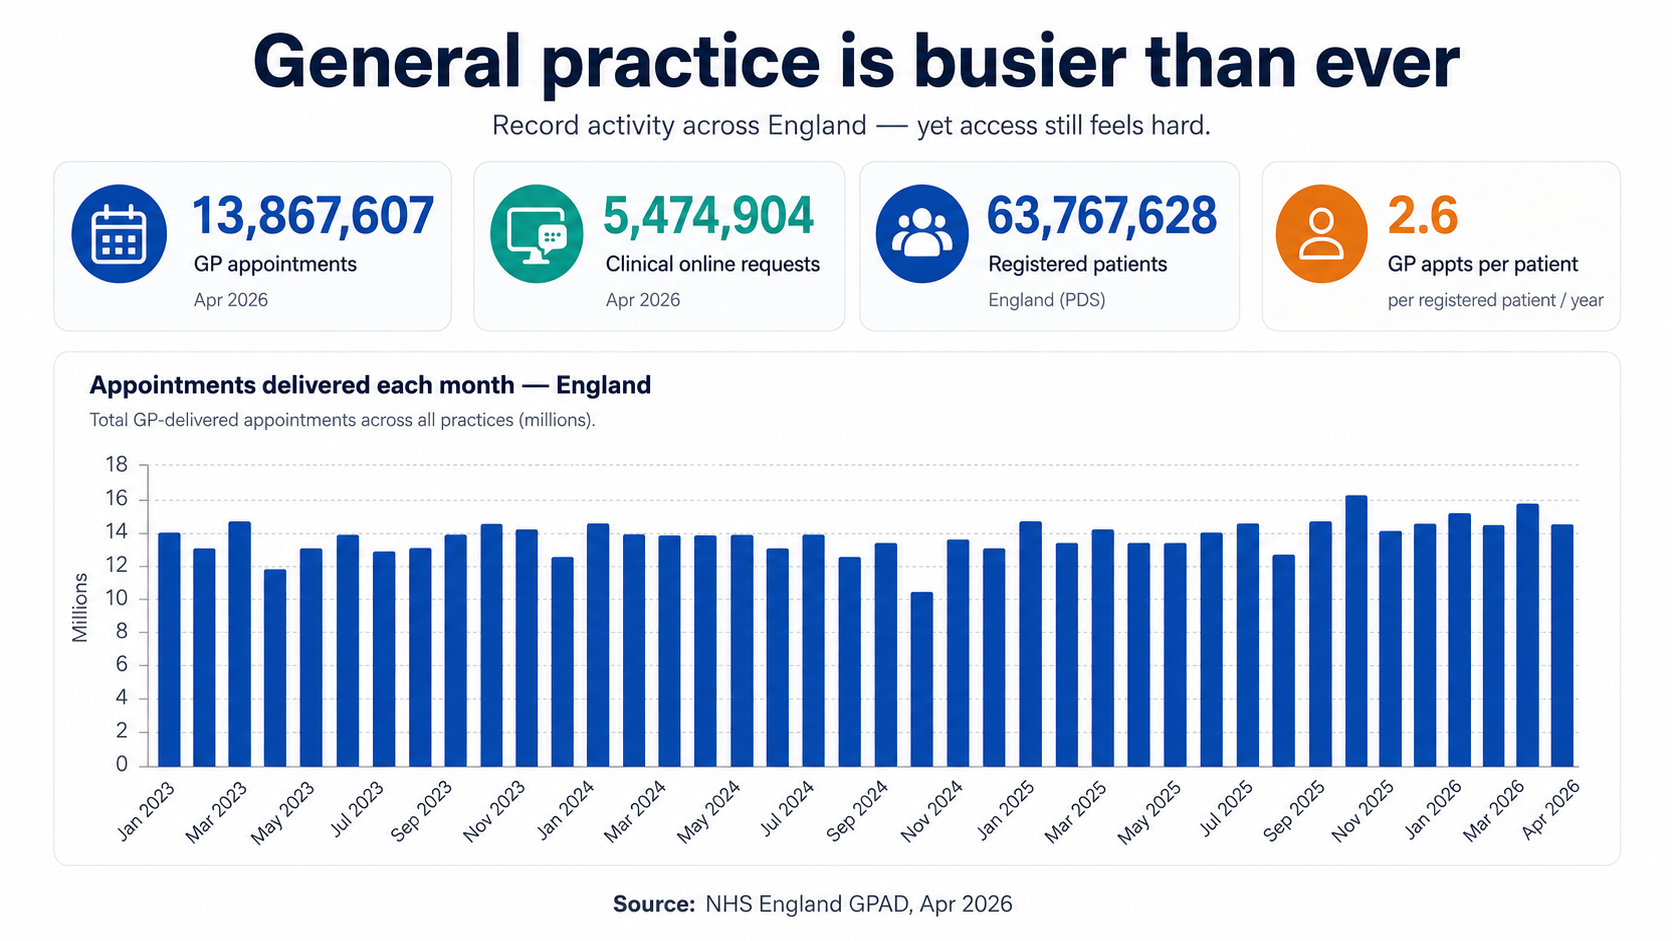
In April 2026, practices in England recorded 13,867,607 GP-delivered appointments. That was 6.1% higher than a year earlier. Across the latest completed 12-month period, practices continued to deliver hundreds of millions of appointments through GPs, nurses, healthcare assistants, pharmacists and other members of the primary care team.1
The national data does not describe a service sitting idle. It describes one operating at sustained high volume, month after month, while also taking on work that may never appear in a conventional appointment count.
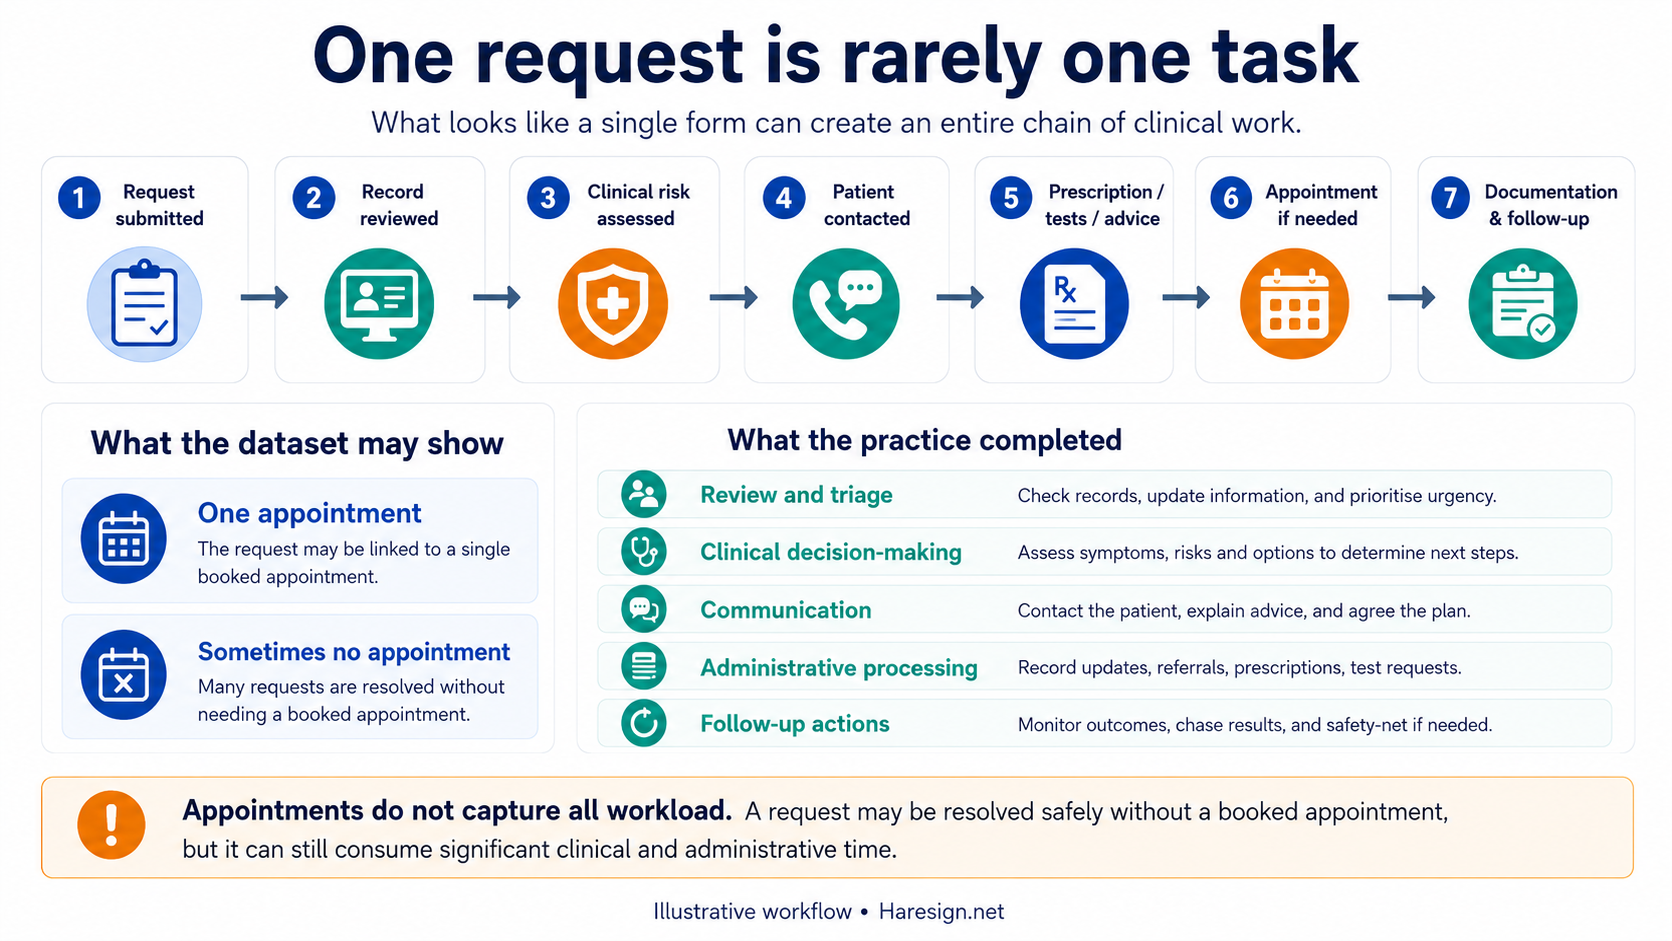
Every request must be received, interpreted and directed. Some requests become face-to-face consultations. Others become telephone calls, prescriptions, investigations, referrals, messages, advice, urgent escalation or work completed without the patient ever entering a consulting room.
The absence of a booked appointment therefore does not mean that no work took place. Increasingly, the appointment is only one possible outcome of a much larger clinical process.
National totals are important, but they can hide the local reality. Demand is not distributed evenly. Practices serving older populations, patients experiencing greater deprivation, higher levels of long-term illness or rapidly expanding housing developments may face substantially greater workload than the national average suggests.
Demand has not disappeared. It has multiplied.
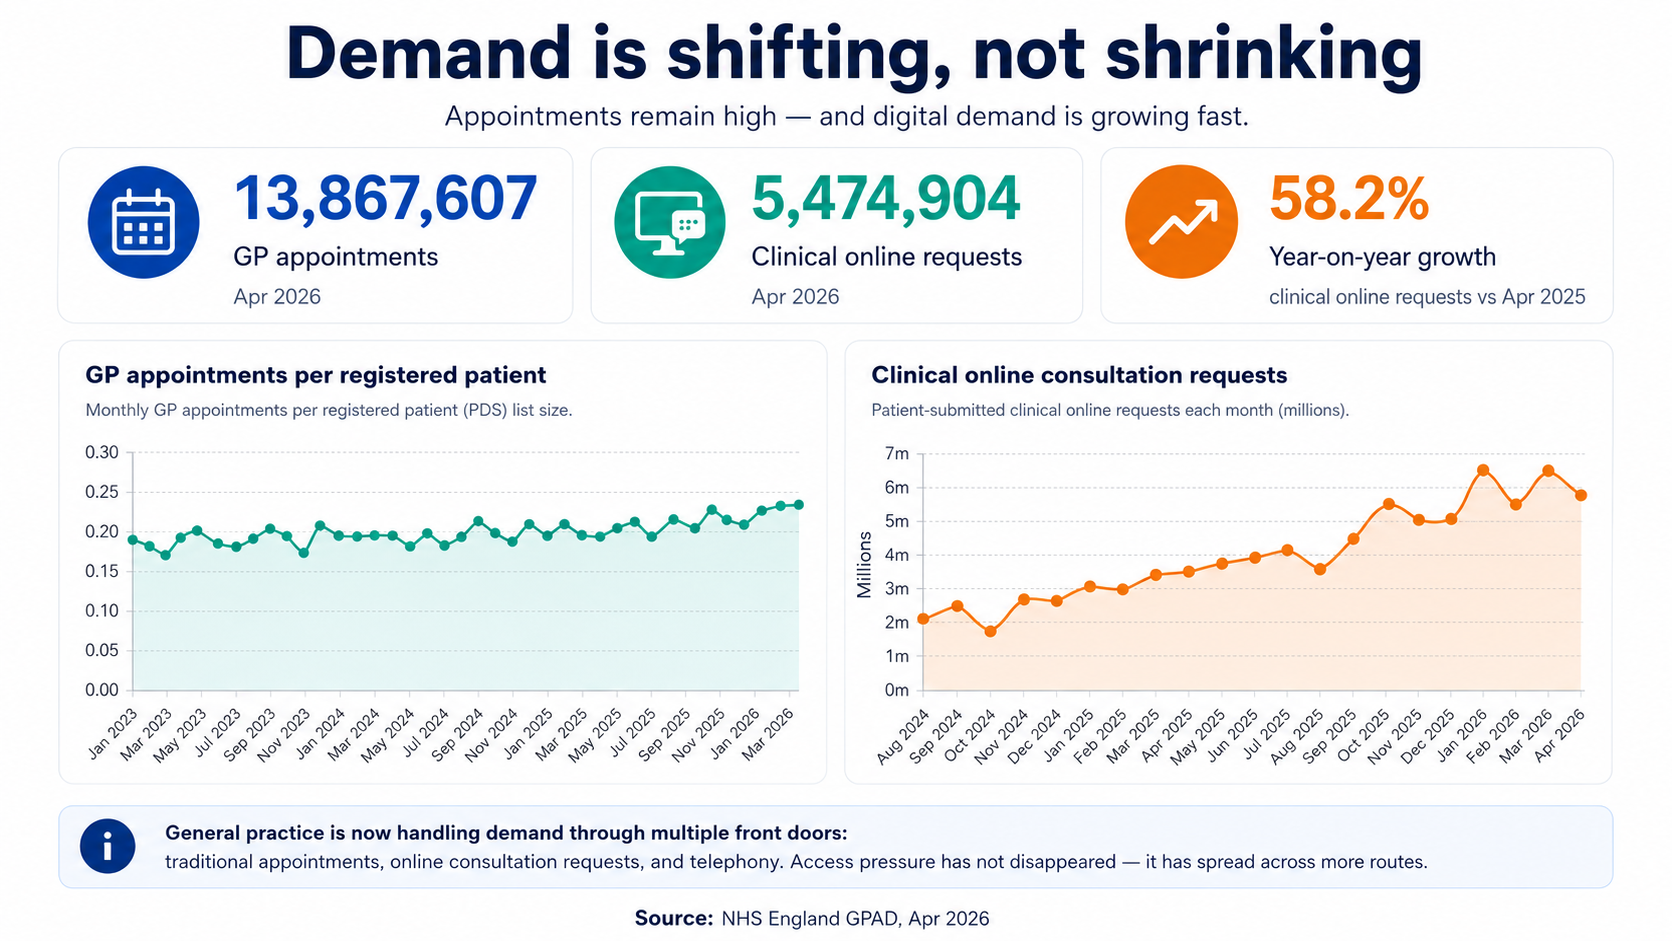
Telephone contact was once the main alternative to a face-to-face consultation. General practice now receives demand through several front doors at once:
Telephone
Calls, callbacks, messages and telephone consultations.
Online requests
Clinical and administrative forms that must be reviewed, prioritised and answered.
Appointments
Care delivered by GPs and the wider multidisciplinary team.
Administrative work
Results, prescriptions, referrals, letters, records and reports.
In April 2026, practices recorded 5,474,904 patient-submitted clinical online requests. That was approximately 58.2% more than in April 2025.1
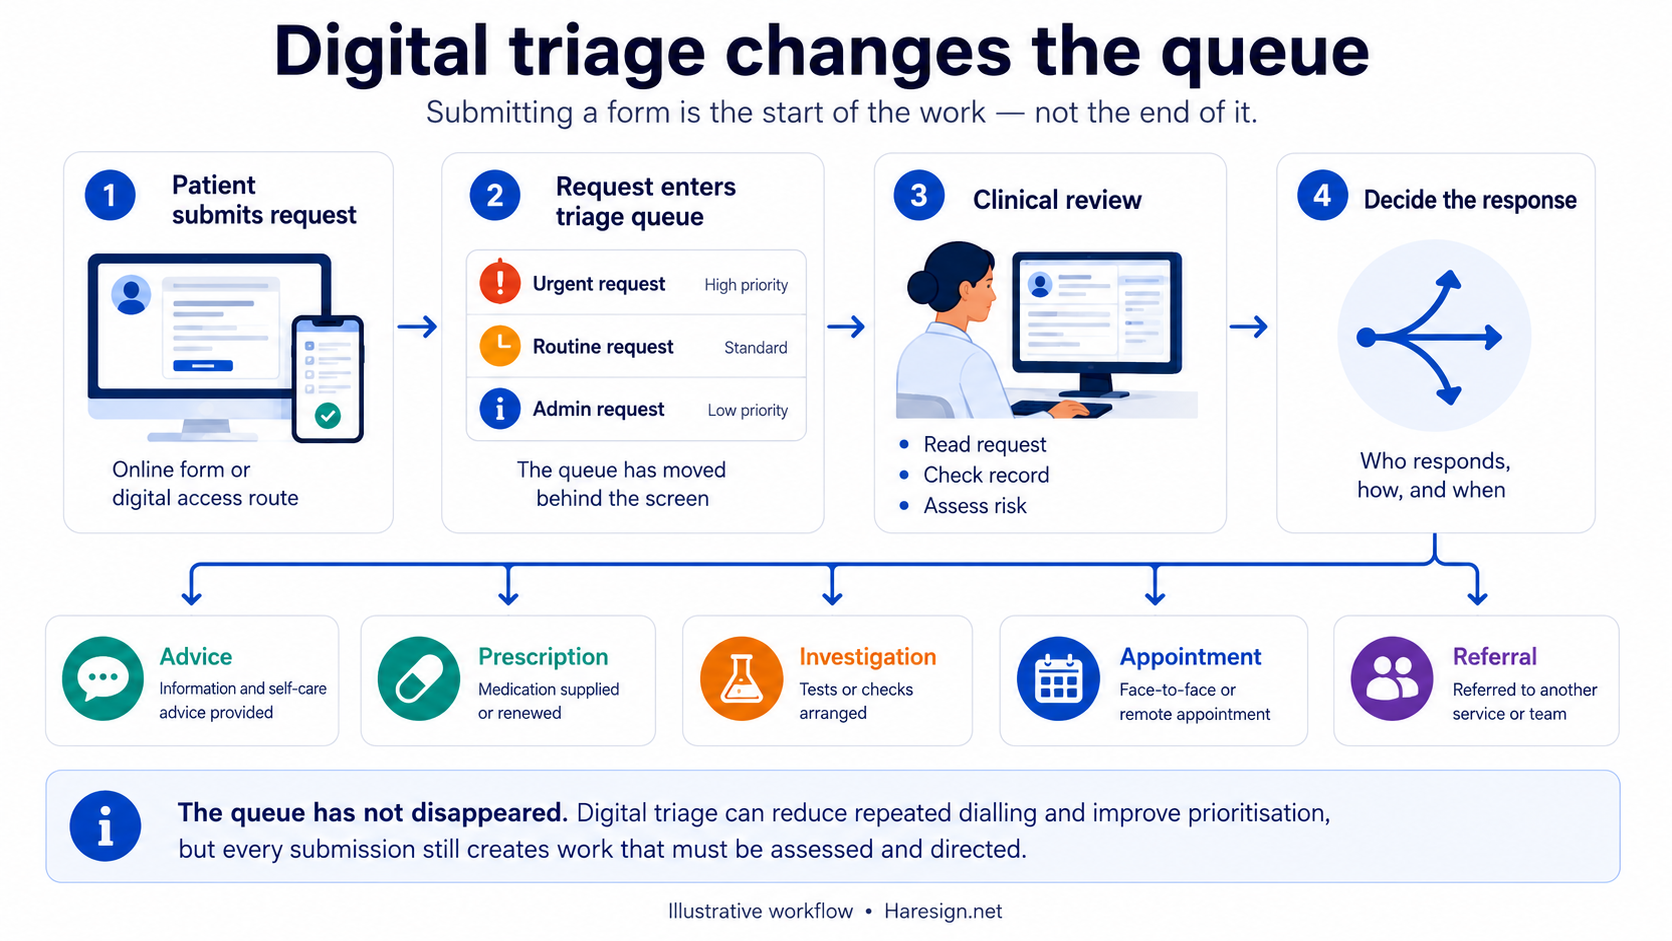
The phrase online consultation can be misleading. In many cases, the patient is not having a consultation at the moment they press submit. They are placing a written request into a clinical intake system. Someone within the practice must then read it, interpret it, assess urgency, review the patient record and decide what happens next.
The outcome may be an appointment, but it may instead be advice, a prescription, an investigation, a referral, a text response or a request for further information. The form is not the care itself. It is the beginning of another workflow.
Digital triage changes the queue. It does not remove it.
The policy argument for digital triage is understandable. Instead of patients competing for a limited number of telephone lines at 8am, they submit information that can be assessed according to clinical need. Practices gain a broader view of demand and can direct patients towards the most appropriate response.
When it works well, this can reduce repeated dialling, improve the information available at the first point of contact and help practices prioritise urgent problems more safely. It can also provide an alternative for patients who cannot remain on hold during the working day.
But the queue has not vanished. It has moved behind the screen.
- Less dependence on repeatedly dialling at 8am
- More information available before the response
- Prioritisation based on clinical need rather than call order
- Alternative access for some working patients and carers
- Better routing to the wider practice team
- A clearer view of previously unmet or suppressed demand
- More GPs or nurses
- Additional consulting rooms
- Unlimited clinical assessment time
- More hours within the working day
- Instant capacity for every submitted request
- Extra funding merely because demand becomes visible
A telephone queue contains its own friction. Lines become engaged, callers wait, some try again later and some abandon the attempt. That experience is frustrating and can be unsafe, but it also acts as a crude limit on how quickly demand reaches the practice.
An online form removes much of that friction. Hundreds of patients can submit requests almost simultaneously. This may be better for the patient than repeatedly hearing an engaged tone, but every accepted submission becomes work that the practice must process.
Is digital demand replacing telephone demand?
Some online requests undoubtedly replace calls that would otherwise have reached reception. However, the relationship is not necessarily one-for-one.
Easier access may also surface need that previously remained hidden: patients who could not get through, patients unable to wait on hold, patients who decided their concern was not worth another attempt, or patients who find a written request easier than explaining the problem verbally.
This is not automatically a bad outcome. Surfacing unmet need may be clinically valuable. Earlier contact could allow a problem to be managed sooner and may reduce barriers for some groups.
The operational problem arises when the system is designed to reveal more demand without providing the staff, time and infrastructure needed to absorb it.
A simple example
Under a traditional model, a patient calls, speaks to reception and receives an appointment. The visible activity is one call and one appointment.
Under a digital-triage model, the patient submits a form, a clinician reviews it, checks the record, sends a message, requests a photograph or more information, reviews the response and then decides whether an appointment is needed. The final dataset may still show only one appointment — or no appointment at all — even though several stages of clinical work have taken place.
What the practice-level analysis shows
We can now go beyond national totals and compare what is happening across individual GP practices.
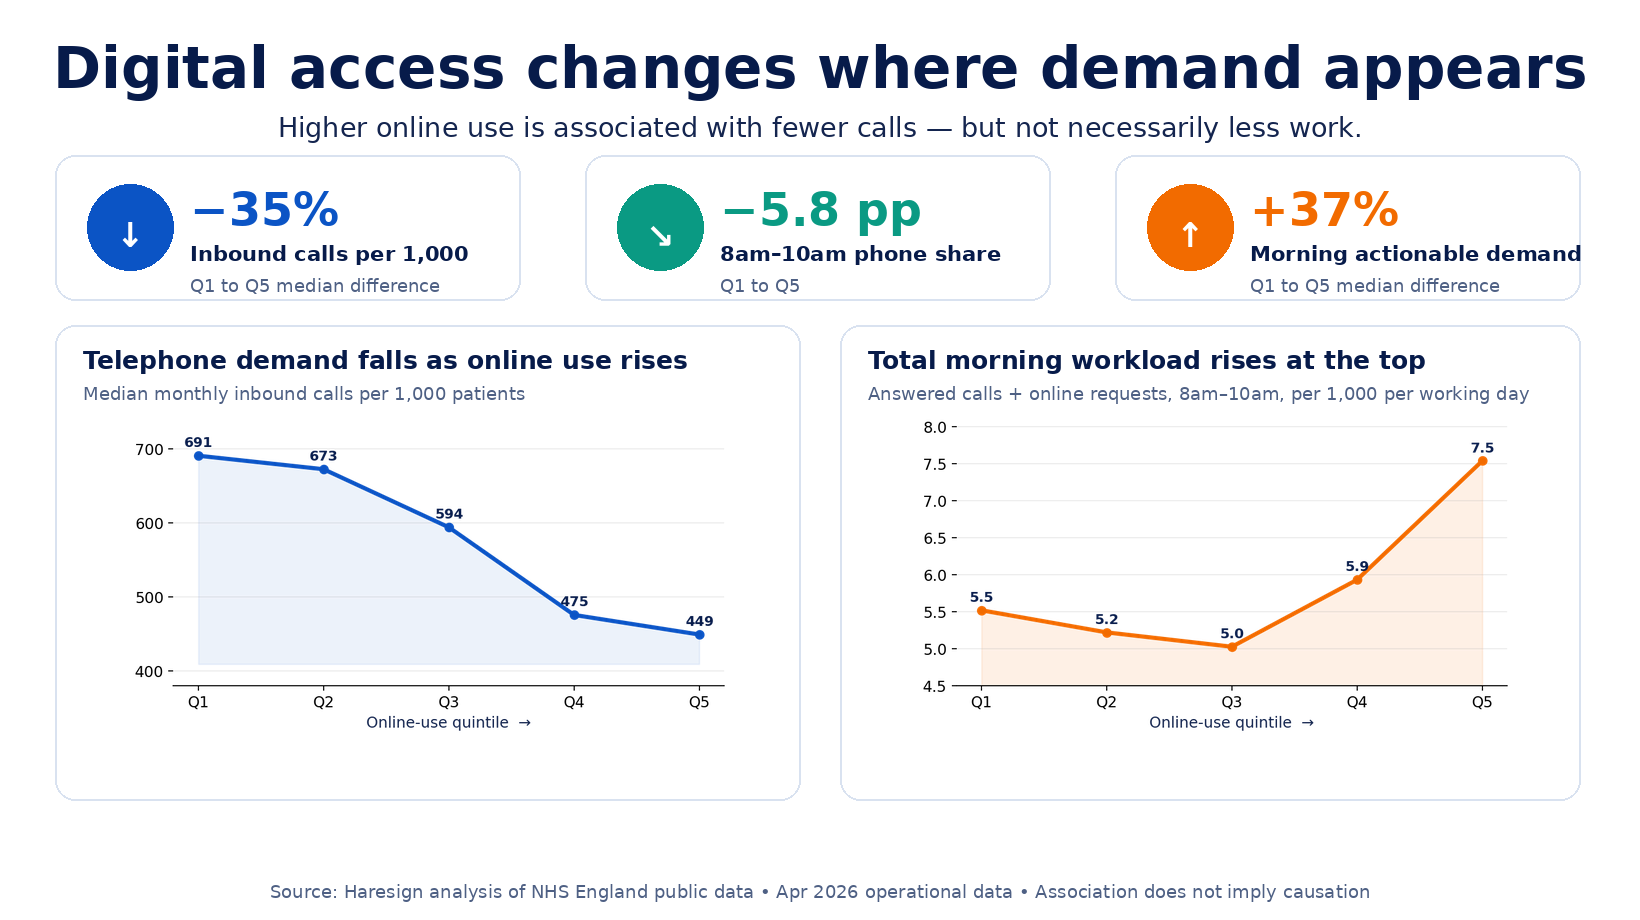
Using published NHS England data, practices were grouped by how heavily they use online consultations. The analysis looked at online requests per 1,000 registered patients and divided practices into five groups — from the lowest users of online access to the highest.
The analysis included 6,107 practices with at least 1,000 registered patients.
There was a significant difference between groups. The lowest online-use practices received a median of 6.95 online requests per 1,000 patients in April 2026, compared with 278.08 per 1,000 patients in the highest-use group.
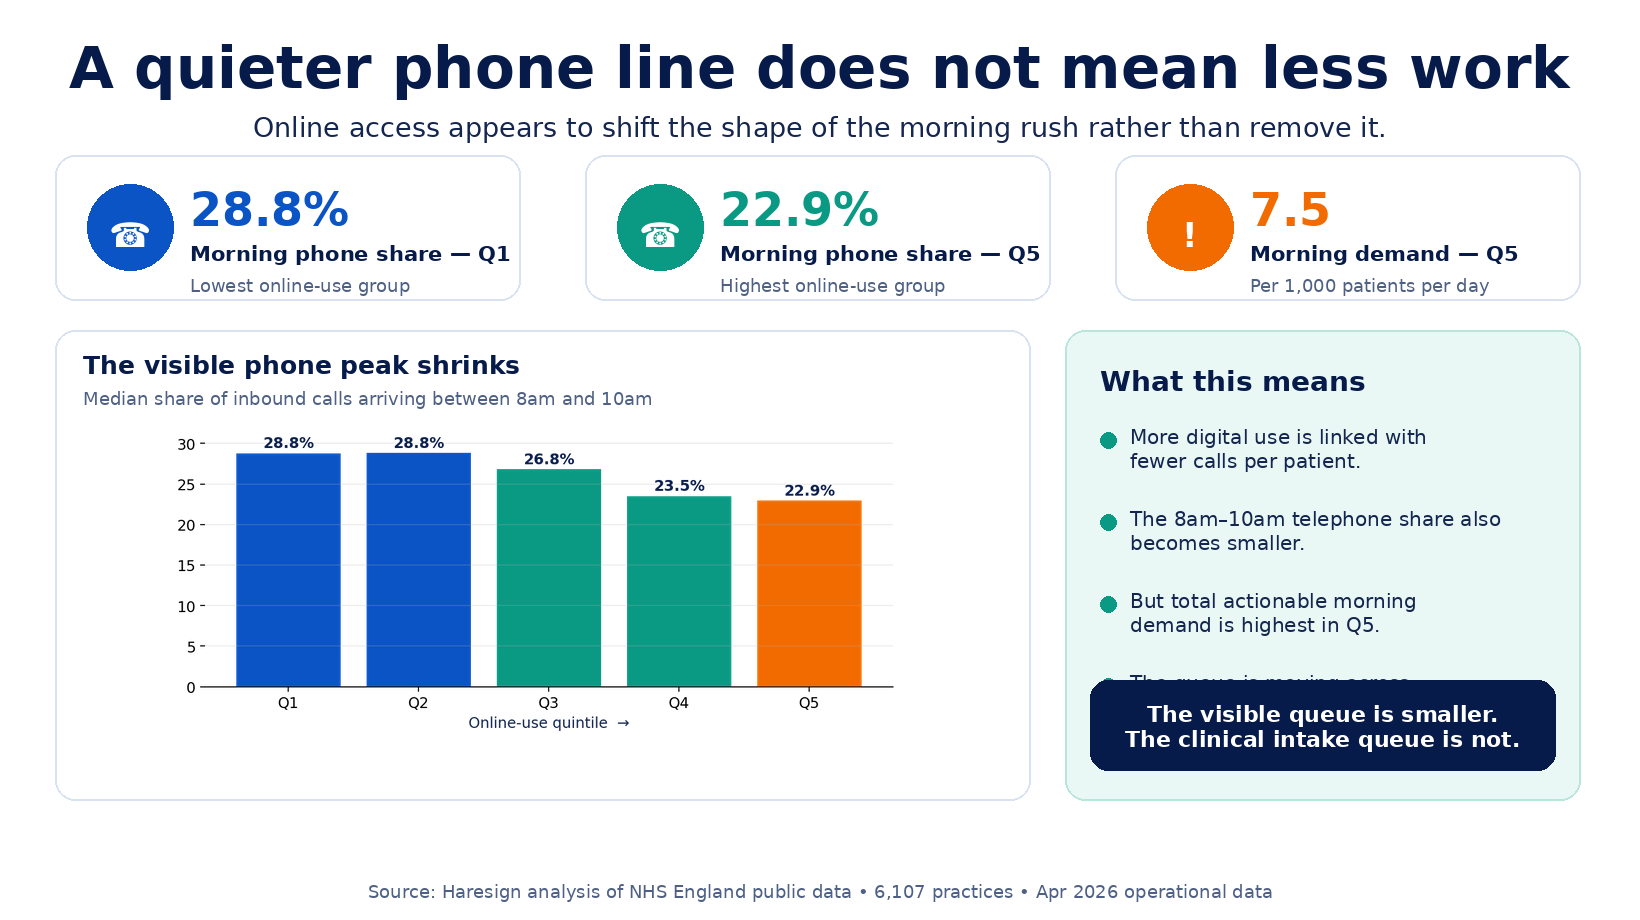
Median calls per 1,000 patients were lower in the highest online-use group.
Less telephone demand was concentrated between 8am and 10am.
Combined phone and online morning demand was higher in the highest-use group.
Practices had complete online, telephone and patient-experience data.
So, did online access fix the phone problem?
The clearest pattern was around telephone demand.
Practices using online consultations more heavily generally received fewer phone calls per patient. This suggests that some demand is moving away from the traditional telephone queue and into digital routes.
The familiar 8am rush was also smaller. Higher online-use practices tended to have less of their telephone demand concentrated into the first two hours of the day.
A quieter phone line does not automatically mean the practice has less work.
Online requests still need to be reviewed, prioritised and responded to. They may result in advice, messages, prescriptions, investigations, referrals or appointments.
When telephone performance itself was compared, higher online use did not consistently mean that calls were answered faster or that a greater proportion of calls were answered.
The evidence suggests digital access changes where patients queue — it does not remove the underlying need for care.
A technically efficient system can still feel difficult
Access is not judged only by whether a request eventually reaches a clinician. Patients also judge how understandable, predictable and human the process feels.
A telephone queue is visibly frustrating. An online queue can be less visible but equally uncertain. Patients may not know:
- who has read the request;
- when they will receive a response;
- whether they are waiting for triage or an appointment;
- whether they should contact the practice again;
- what to do if their condition changes;
- or why an appointment was not offered.
From the practice perspective, the request may have been assessed and safely directed. From the patient perspective, the experience can still feel like a barrier between them and their GP.
Good digital access therefore requires more than a form. It needs clear response times, visible safety-netting, accessible alternatives, understandable decisions and routes for patients who cannot use the digital process.
Clarity
Patients should know what will happen after submission and when they should expect a response.
Choice
Telephone and supported routes must remain available for patients who cannot use an online form.
Continuity
Efficient routing should not automatically mean losing access to a clinician who already understands the patient.
What does the national data tell us about the 8am rush?
Digital access is often presented as the answer to the traditional 8am telephone scramble. In theory, patients should no longer need to compete for a limited number of telephone lines at the start of the day.
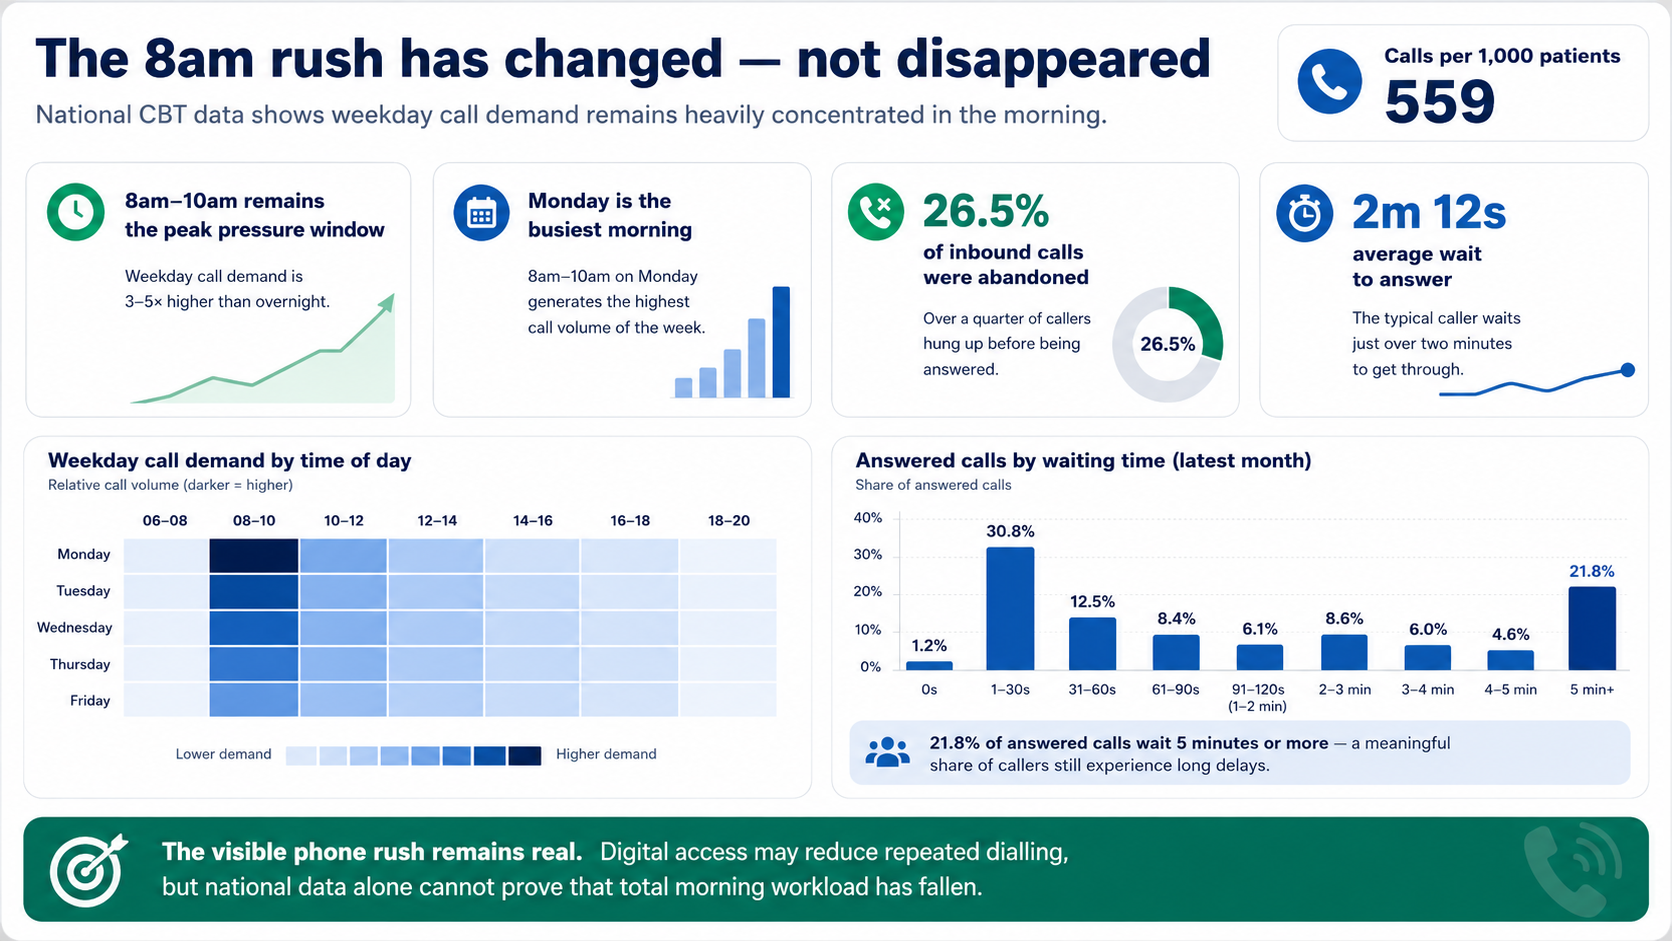
The national telephony data shows that the morning rush is still very real. Across England, weekday inbound call demand remains heavily concentrated between 8am and 10am, with Monday producing the largest morning peak.
The pattern is visible not only in the number of calls received, but also in the waiting-time distribution. A substantial proportion of patients are answered quickly, but a significant group still waits more than five minutes before their call is answered.
8am to 10am
The busiest weekday period for incoming calls to general practice.
Monday
The largest concentration of national inbound call demand occurs on Monday morning.
More than five minutes
A material proportion of answered calls still fall into the five-minute-plus waiting-time band.
Has digital access ended the rush — or moved it?
The national call data can show us the visible telephone queue. It cannot show the full amount of work arriving through other channels at the same time.
Online consultation requests also tend to arrive heavily in the morning. Every submission must be read, checked, assessed and directed. Even where the number of telephone calls falls, the total volume of actionable work reaching the practice may not fall with it.
What may improve
- Fewer patients repeatedly dialling at 8am
- A lower concentration of calls in the first two hours
- Improved answer rates for the calls that remain
- More options for patients who cannot wait on hold
What may increase
- Online submissions arriving during the same morning window
- Clinical triage work behind the screen
- Requests that previously would not have reached the practice
- Total actionable demand requiring a same-day response
Digital access may ease the telephone rush while intensifying the clinical intake rush behind it.
That distinction matters. A quieter phone line is a better experience for patients trying to call, but it should not automatically be interpreted as lower workload for the practice.
Are patients happier with modern access?
The national GP Patient Survey provides a more nuanced answer than a simple yes or no.
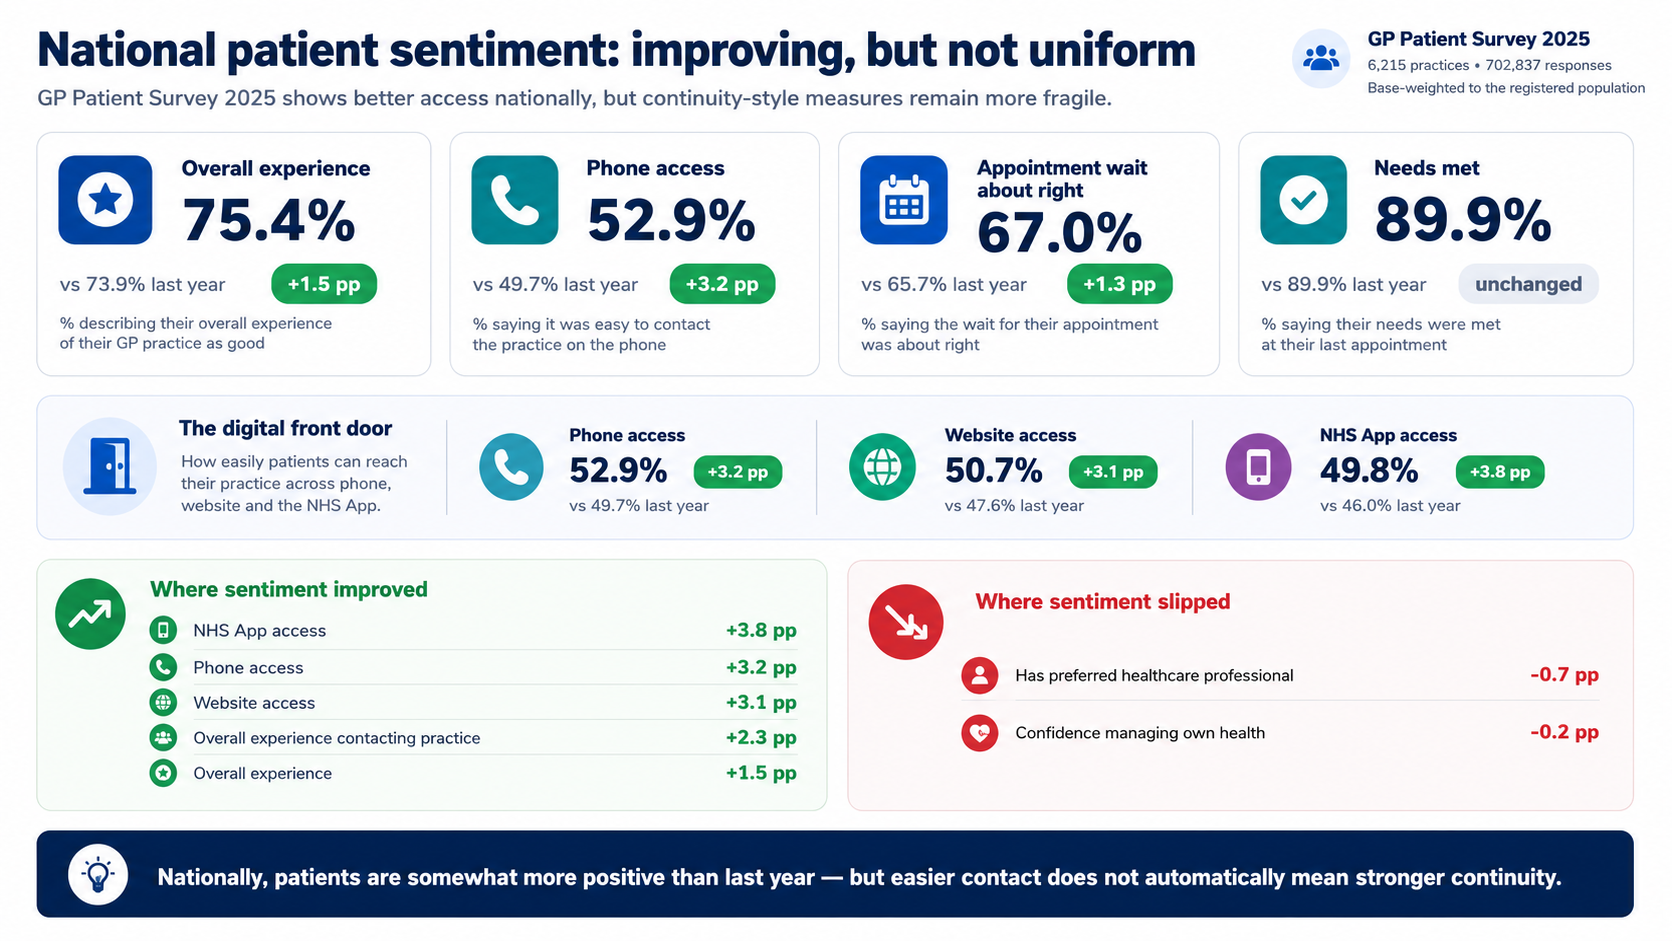
In the 2025 survey, several headline access measures improved compared with the previous year. Nationally:
Ease of contact also improved across all three national access channels: telephone, practice websites and the NHS App.
Improvement does not mean every part of the experience is better
The national results do not support the claim that patients are uniformly less satisfied. The overall picture is more positive than the year before.
However, the areas that declined are revealing. The proportion of patients reporting that they had a preferred healthcare professional fell, and confidence in managing their own health also slipped slightly.
- NHS App access
- Phone access
- Website access
- Overall experience of contacting the practice
- Overall practice experience
- Having a preferred healthcare professional
- Confidence in managing health
That is an important distinction. Digital access may improve the front end of the patient journey while making the service feel more transactional if requests are repeatedly routed to whichever clinician is available.
A modern access model should therefore be judged not only by how easy it is to submit a request, but by whether the patient receives a clear response, feels that their needs were understood and retains continuity where it adds clinical value.
Access is not the same as continuity
Triage systems are designed to move each request towards the next available and appropriate response. That can be efficient for a self-contained problem.
General practice, however, is not only a collection of isolated transactions. Much of its value comes from continuity: a clinician who understands the patient’s history, recognises changes over time and can connect today’s concern with previous consultations.
A system optimised entirely around rapid distribution can fragment that relationship. The request may be handled by whichever clinician is processing the triage queue rather than the clinician who knows the patient best.
This matters particularly for multimorbidity, mental health, frailty, safeguarding and long-term condition management. These are areas where speed of initial contact is valuable, but relational knowledge may be just as important as rapid routing.
The challenge is therefore not to choose between access and continuity. It is to design access systems that protect continuity where continuity adds clinical value.
Why the telephone experience can still feel so difficult
For many patients, the pressure becomes visible at 8am. That makes the telephone system an easy target, but the queue is usually a symptom of the wider capacity problem rather than its cause.
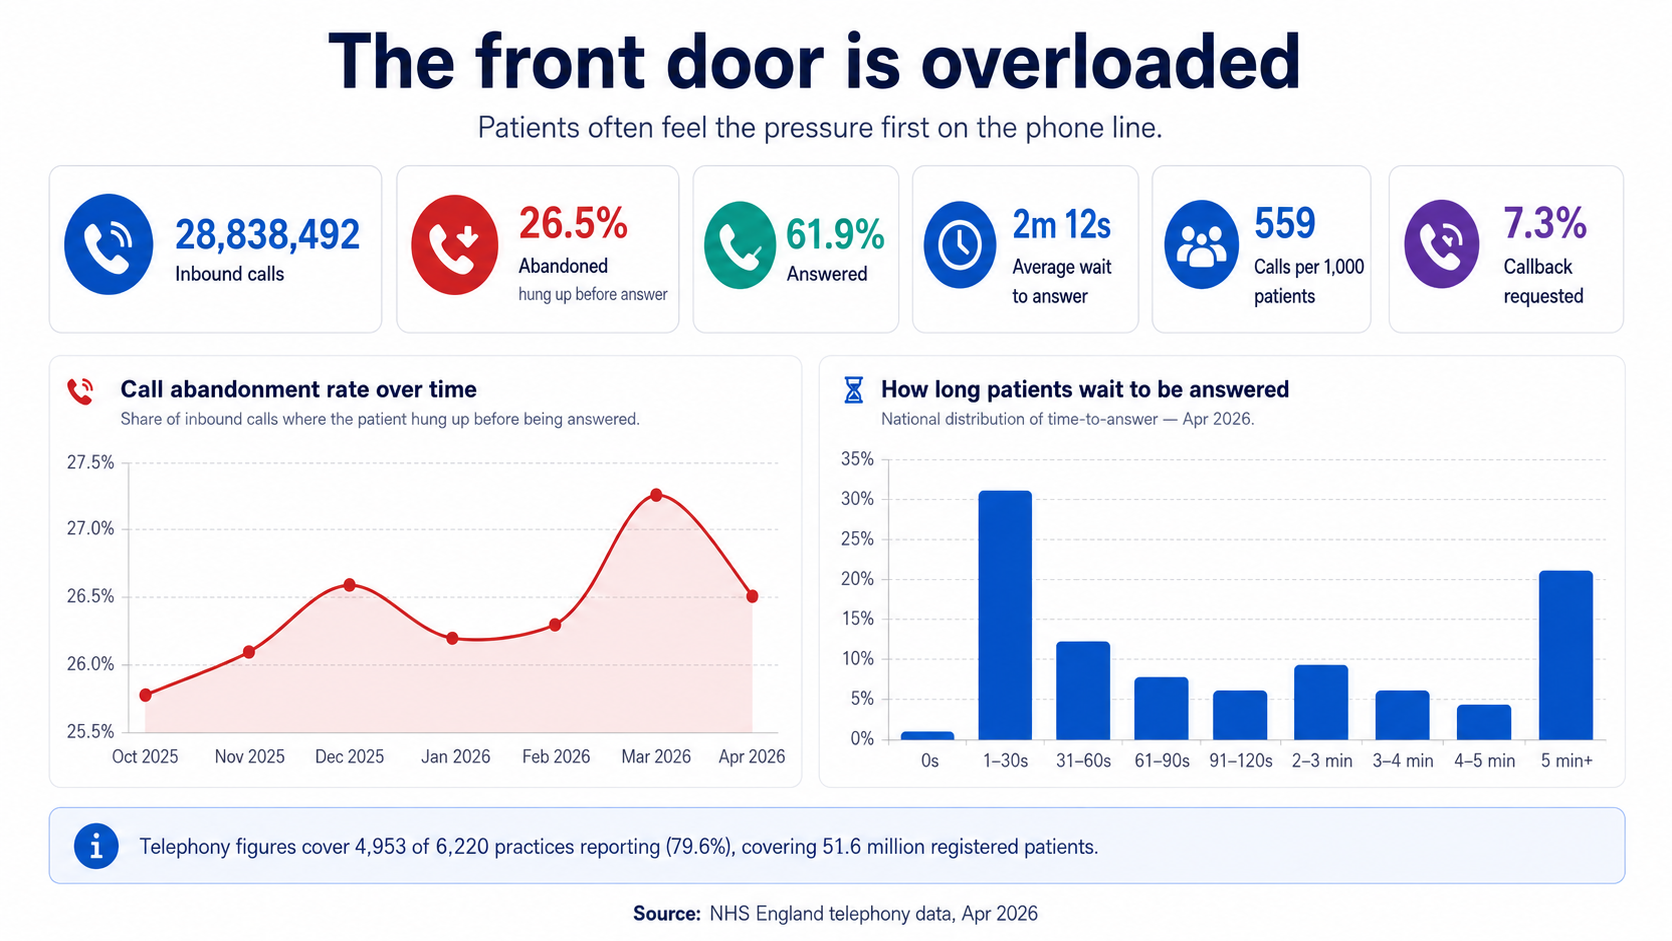
The available national telephony data for April 2026 recorded 28,838,492 incoming calls from the practices submitting data. Of those calls:
- Calls answered 61.9%
- Calls abandoned before answer 26.5%
- Average wait before answer 2 minutes 12 seconds
- Calls per 1,000 registered patients 559
- Calls requesting a callback 7.3%
These figures cover 4,953 of 6,220 practices, representing 79.6% of practices and approximately 51.6 million registered patients.2 They should therefore be interpreted with the reporting coverage in mind.
Abandoned calls do not all represent separate patients who received no help. Some callers redial, use a callback option, submit an online request or make contact through another route.
Nevertheless, the figure clearly shows the frustration and repeated effort generated when demand reaches practices faster than teams can process it.
Now follow the money
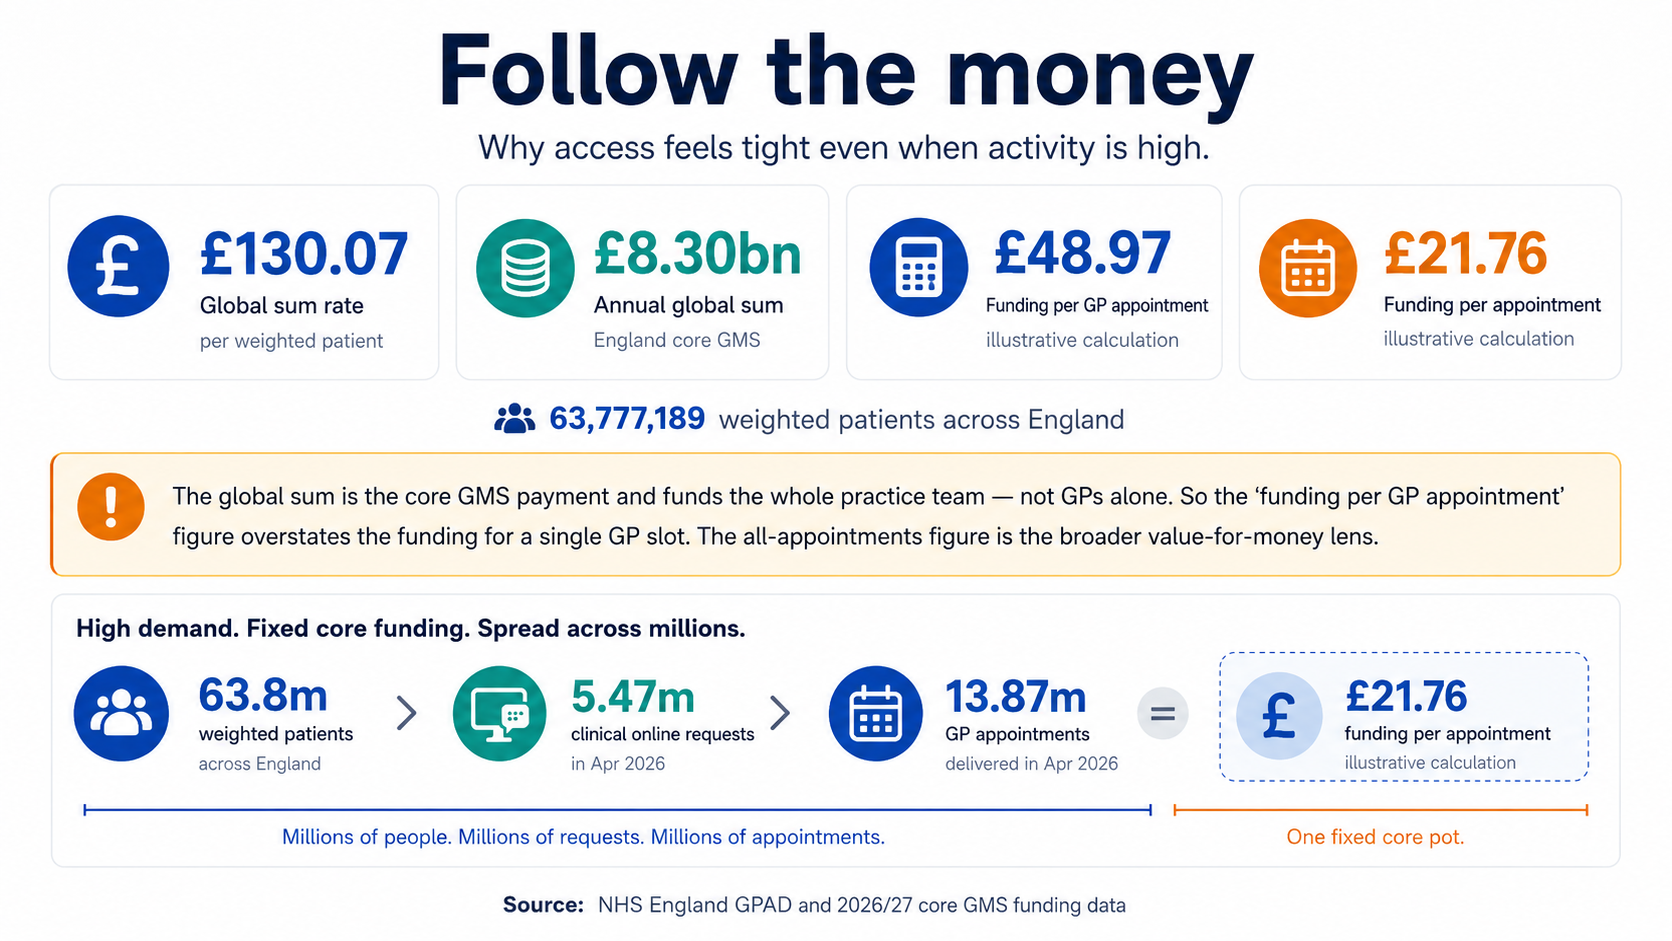
The core General Medical Services global sum for 2026/27 is £130.07 per weighted patient.3 The word weighted matters: practices are not simply paid £130.07 for every person on their registered list.
The Carr-Hill formula adjusts practice populations to reflect factors including age, sex, morbidity, list turnover and local costs.
Applied to approximately 63,777,189 weighted patients across England, the global-sum rate produces an illustrative annual total of about £8.30 billion.
That sounds substantial — and it is — but it funds considerably more than a supply of GP appointments.
- GPs, nurses and healthcare assistants
- Reception, administration and management teams
- Premises and facilities
- Clinical systems and telecommunications
- Digital triage and online-access workflows
- Indemnity, insurance and professional costs
- Equipment, utilities and consumables
- Regulation, governance and mandatory compliance
- Results, prescriptions, referrals and non-contact work
- A payment made for each GP consultation
- A ring-fenced budget for appointment slots
- The salary of an individual GP
- A measure of practice profit
- The full value of every practice income stream
- A guarantee that capacity rises with daily demand
- A separate payment for every online request processed
Practices may receive additional income through the Quality and Outcomes Framework, Primary Care Network arrangements, enhanced services, premises reimbursements and other schemes.
However, much of that funding is conditional, specified or tied to additional activity. It cannot automatically be treated as spare money available to create routine GP appointments or process an unlimited number of digital submissions.
What does the core funding look like against activity?
Dividing the estimated annual global sum by the latest trailing 12 months of GP-delivered appointments produces an illustrative figure of approximately £48.97 per GP appointment.
Dividing it by all recorded general-practice appointments produces an illustrative figure of approximately £21.76 per appointment.
These are comparisons, not payment rates
A practice is not paid £48.97 whenever a GP sees a patient, nor £21.76 whenever any appointment takes place. The calculation spreads the core global-sum pot across recorded activity to illustrate the scale of the funding available. Because the global sum also funds the infrastructure and wider team, the amount available for the consultation itself is necessarily lower.
The comparison also excludes significant work that is not always represented as a conventional appointment: reviewing results, issuing prescriptions, processing hospital correspondence, safeguarding work, referrals, reports, clinical supervision, care-home coordination and the clinical processing of online requests.
That is the structural issue. General practice is funded predominantly through population-based contractual arrangements, while demand arrives as an uncapped stream of calls, forms, messages, appointments and clinical risk.
Digital access exposes the funding gap
Digital triage does not create the underlying demand. It makes more of that demand visible and allows it to arrive with less friction.
That may be clinically and ethically preferable to demand being hidden behind an engaged telephone line. But once the demand is visible, the practice remains responsible for dealing with it safely.
This is where the policy ambition and the funding model collide. Practices are encouraged to open wider digital routes, surface unmet need and respond according to clinical priority. Yet the core payment does not automatically increase each time another form is submitted.
The digital-access paradox
A successful access system makes it easier for patients to ask for help.
Easier access increases the amount of demand that becomes visible.
Visible demand must be assessed, documented and resolved safely.
Unless capacity grows with the demand, improved access to the front door can produce greater pressure behind it.
Why access can feel worse even when more work is being done
Access is experienced individually. A national increase of several million appointments offers little comfort to somebody who cannot secure the particular appointment they need at their own practice.
Both of these statements can therefore be true:
General practice is delivering more activity
National datasets show sustained appointment volumes and rapidly growing online demand.
Patients can still struggle to obtain care
Demand can exceed the available capacity for particular clinicians, times, locations and appointment types.
The contradiction disappears once we distinguish total activity from available capacity. A practice can be busier than ever and still have no safe additional appointments to release.
More contacts can also generate more follow-up work. An online request may lead to a telephone assessment, a face-to-face appointment, blood tests, a prescription and a referral. Counting only the eventual appointment misses the chain of work that produced it.
It can also miss the opportunity cost. Time spent processing immediate requests is time that cannot simultaneously be used for medication reviews, proactive prevention, continuity, long-term condition management or follow-up work.
Capacity is also physical
Workforce is only one constraint. A clinician cannot hold a confidential consultation without a suitable room, functioning equipment and the administrative infrastructure around them.
Lord Darzi’s 2024 investigation reported that 20% of the primary care estate predates the foundation of the NHS in 1948 .4
Practices may therefore be asked to expand teams and deliver more care from buildings that were never designed for modern multidisciplinary general practice. Recruiting another clinician does not create another consulting room.
What the analysis can — and cannot — tell us
The practice-level results answer two important questions more clearly than national totals alone.
- Higher online use is associated with fewer inbound calls per patient.
- The 8am–10am telephone share is smaller in higher-use practices.
- Online access appears to shift some demand away from the telephone.
- Total actionable morning demand is not lower in the highest-use group.
- Higher use is not associated with materially better call answer rates.
- That digital access caused the differences between practices.
- That every online request replaced a telephone call.
- That higher digital use created poorer patient experience.
- That all practices have comparable populations or operating models.
- That the annual survey and monthly operational measures describe precisely the same period.
Patient experience and continuity
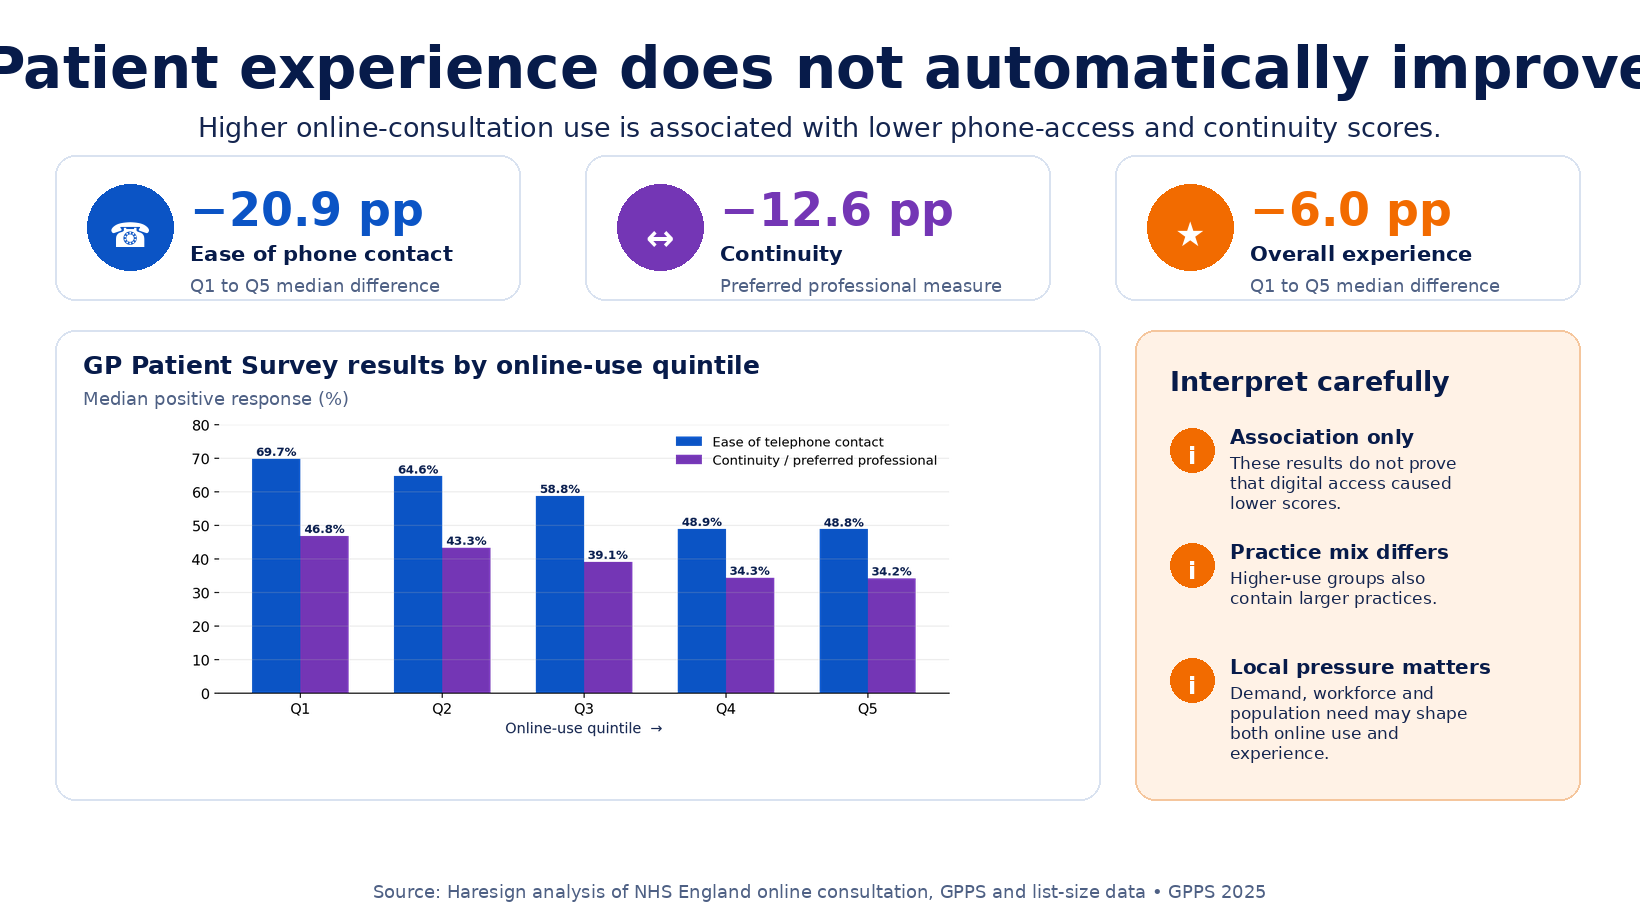
The highest online-use group had a median GP Patient Survey score of 48.8% for ease of telephone contact, compared with 69.7% in the lowest-use group.
The continuity measure — patients reporting that they saw or spoke to their preferred healthcare professional — was 34.2% in the highest-use group and 46.8% in the lowest-use group.
Overall experience was also lower in the highest-use group: 75.9% compared with 81.9%.
The correlations were moderate for telephone experience (ρ = −0.36) and weak for continuity (ρ = −0.27) and overall experience (ρ = −0.22).
What would improve access?
There is no single switch that will solve the problem. Sustainable access requires the different parts of the system to move together.
The real answer
Patients struggle to obtain GP appointments not because general practice has stopped delivering them, but because the service is absorbing more demand, through more channels, with finite staff, rooms and core funding.
The practice-level analysis adds an important piece to that picture. Higher online-consultation use is associated with fewer telephone calls and a smaller 8am–10am telephone share. Digital access is therefore changing where demand appears.
But the same analysis does not show that total morning workload falls. The highest online-use group had the highest combined actionable demand between 8am and 10am. Nor did higher digital use automatically produce better call answer rates, patient experience or continuity.
Digital triage can improve the way requests enter the system. It can reduce repeated dialling, provide better information and help prioritise clinical need. It can also expose unmet demand and create a layer of clinical processing that appointment statistics do not fully capture.
Practices can redesign telephone queues, introduce online forms and make appointment books more efficient. Those changes matter. But efficiency cannot indefinitely compensate for a structural gap between what the service is expected to provide and the capacity available to provide it.
General practice does not have an appointment problem in isolation. It has a capacity, infrastructure, measurement and funding problem that patients experience as an appointment problem.
Methodology and important context
National appointment and online-request figures are drawn from NHS England published datasets. Telephony figures reflect practices reporting through supported Cloud Based Telephony suppliers and are not a complete census of every practice.
The practice-level analysis ranked practices by online-consultation submissions per 1,000 registered patients and divided them into five approximately equal groups. Practices with fewer than 1,000 registered patients were excluded to reduce instability in rate-based comparisons.
The analysis included 6,107 practices. Quintile boundaries were 14.0, 40.376, 121.298 and 234.4 online submissions per 1,000 patients. Tied values were kept within the same group, so group sizes were not perfectly equal.
Online-consultation and telephony measures use April 2026. Registered list size uses June 2026. Workforce uses the 31 March 2026 snapshot. GP Patient Survey measures use the 2025 survey. These periods are close but not fully aligned, and the survey is annual rather than monthly.
Actionable morning demand was calculated as answered telephone calls plus online submissions received between 8am and 10am, divided by registered list size and the 22 Monday-to-Friday working days in April 2026. Bank holidays were not removed from that working-day denominator.
Spearman rank correlations were used because the practice-level measures are not normally distributed and contain substantial variation. Correlation coefficients describe association, not causation. P-values were not calculated in this analysis.
Complete-case sensitivity analysis included 4,935 practices with valid online, core telephony and overall GP Patient Survey data. Its results were materially similar to the main analysis.
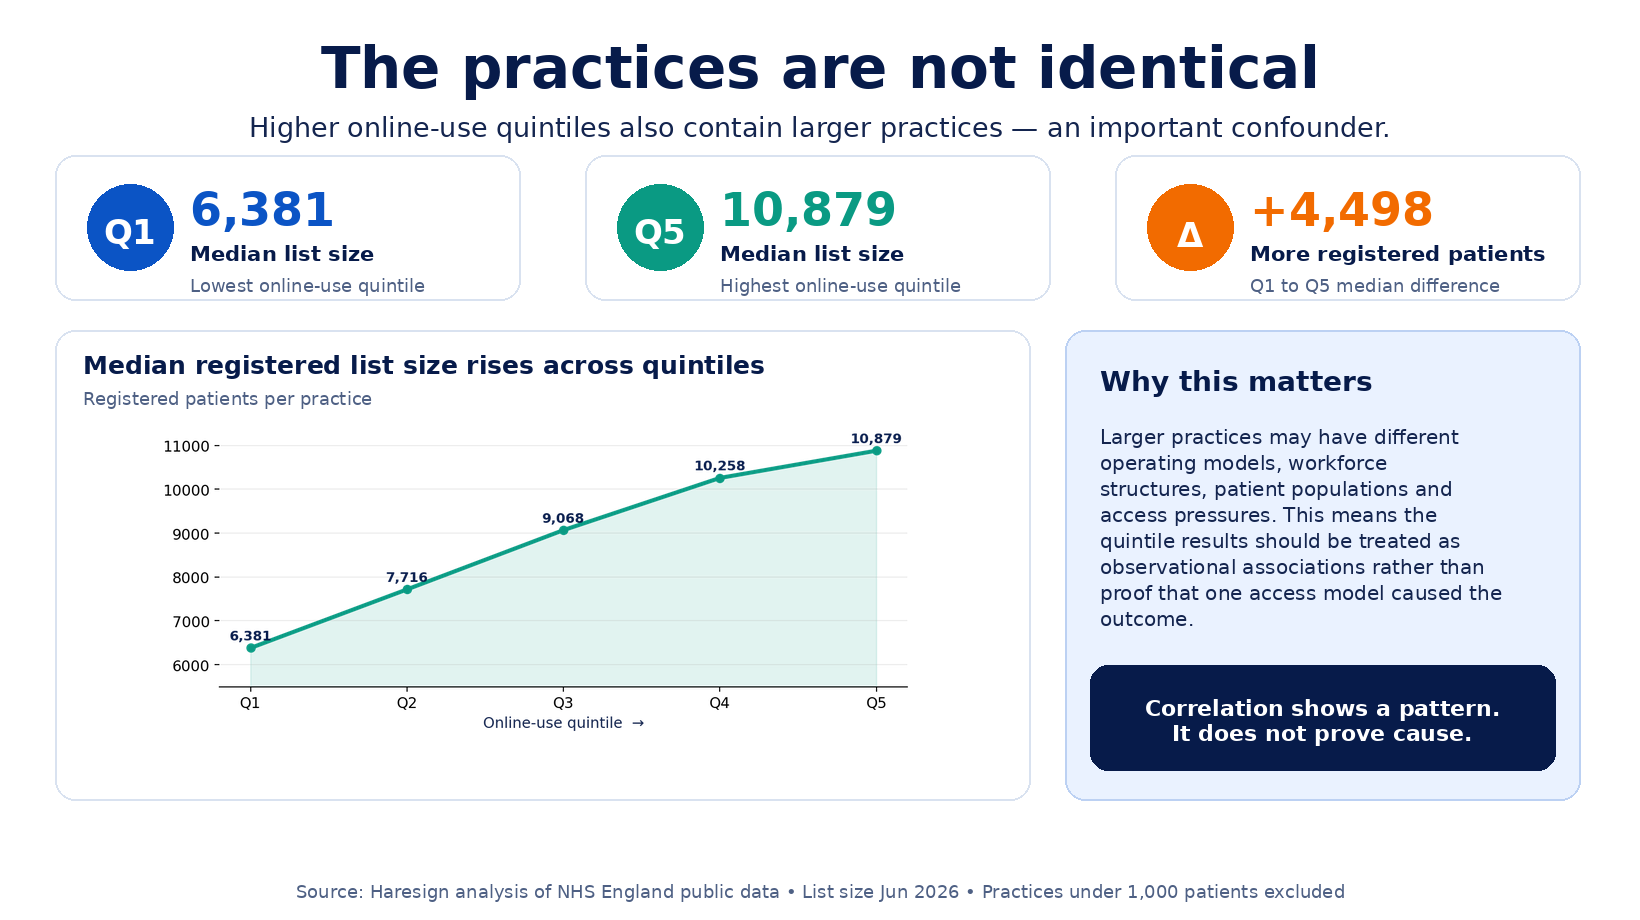
Deprivation was not included because a suitable practice-level deprivation dataset was not available in the analysis layer. Higher-use groups also had larger median list sizes, so residual confounding remains likely.
The annual global-sum and per-appointment figures are calculations produced by combining published population, contractual funding and activity data. They illustrate scale and should not be interpreted as actual payments made for individual appointments.
Figures may be revised in later NHS publications. Totals and percentages have been rounded where appropriate.